
Issue #8467
closed
RQ worker takes up a lot of RAM when syncing OL7 repository
Description
A user reported (https://community.theforeman.org/t/katello-4-0rc2-oom-kill-doing-large-yum-repo-sync/22881/12) seeing rq (worker) taking up 9.3 GB of RAM when syncing http://yum.oracle.com/repo/OracleLinux/OL7/latest/x86_64/. I tried it myself and noticed 8.2 GB of RAM. It seems like a decent bit, so I'd like to know if it's abnormal.
Tested on Katello 3.18.2.
Pulp versions:
pulp-2to3-migration (0.9.1)
pulp-certguard (1.0.3)
pulp-container (2.1.0)
pulp-deb (2.7.0)
pulp-file (1.3.0)
pulp-rpm (3.9.0)
pulpcore (3.7.3)
Files
Related issues
 Updated by dalley over 3 years ago
There was another offline report of this. Usually when we hit memory leak issues it's actually in some other library, so I ran valgrind on createrepo_c again, and hit this: https://github.com/rpm-software-management/createrepo_c/issues/259
They look new, I don't recall seeing these last time we were investigating memory leaks in createrepo_c. It could also be unrelated, or only partially related - but I think it's a good place to start.
Updated by dalley over 3 years ago
- Priority changed from Normal to High
- Triaged changed from No to Yes
Updated by dalley over 3 years ago
So, I don't think that there is a bug here, either in createrepo_c or in Pulp.
It appears that in this oracle repo, other.xml is MASSIVE. Compressed, it is 960 megabytes, and uncompressed, it is 4.2 gigabytes. Compare to the CentOS 7 other.xml metadata which is, at present, 1.5 megabytes compressed.
It's possible that there are ways in which we could be better handling this quantity of data, but createrepo_c isn't built in such a way that we can parse everything in a streaming fashion, everything is kept in memory as it is processed. That puts a very significant lower bound on the sort of memory usage we can expect from parsing such a repository.
I stepped through with a debugger, and verified that the memory explosion happens when parsing other.xml.
1.64gb mem used before parsing primary.xml
1.83gb mem used after parsing primary.xml, before parsing filelists.xml
2.13gb mem used after parsing filelists.xml, before parsing other.xml
-- watched it blow through the system memory and get killed while parsing other.xml --
All of which is to say, yes, it's definitely abnormal, but it's not clear that it's a problem with Pulp or createrepo_c.
Updated by dalley over 3 years ago
- File baseline.png baseline.png added
- File with_extract_data.png with_extract_data.png added
- File drop_package_mitigation.png drop_package_mitigation.png added
A little more background - and some ideas for how we can potentially improve Pulp.
Some testing was done that showed that Pulp was spiking high enough to run out of memory even on a box with >11gb of RAM running only Pulp 3 + Katello, which is a problem.
I ran some tests which showed that the memory usage of createrepo_c alone is about what we would expect. The memory cost of processing a repository is roughly the (decompressed) size of the metadata - larger metadata, more memory consumption. I used the OL7 repository for testing since it's the largest one I've seen so far, larger even than RHEL7.
This is a baseline result using a script that just parses the repo metadata into a dict like we do, and nothing else. It peaks at around 5.1gb of memory, which is a bit bigger than the actual metadata (other.xml alone is 4.2gb)
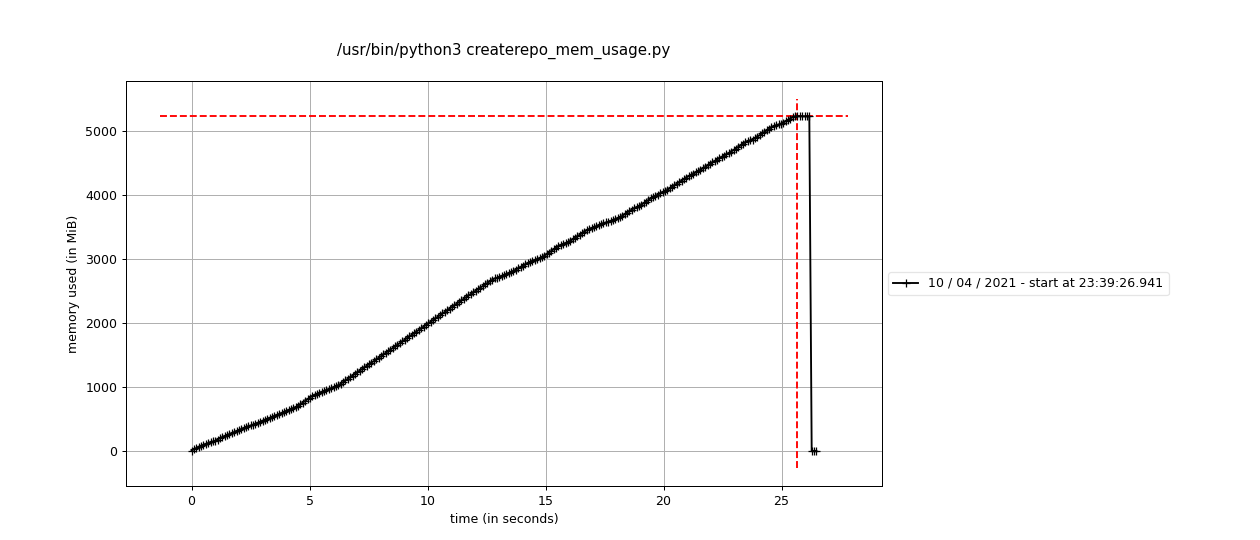
But this baseline doesn't really do anything with the data. Notably, it's all still stored in the C extension at this point. When we pull the data out on the Python side, it gets copied into new Python strings, so it now exists in memory twice (until the Python string gets garbage collected).
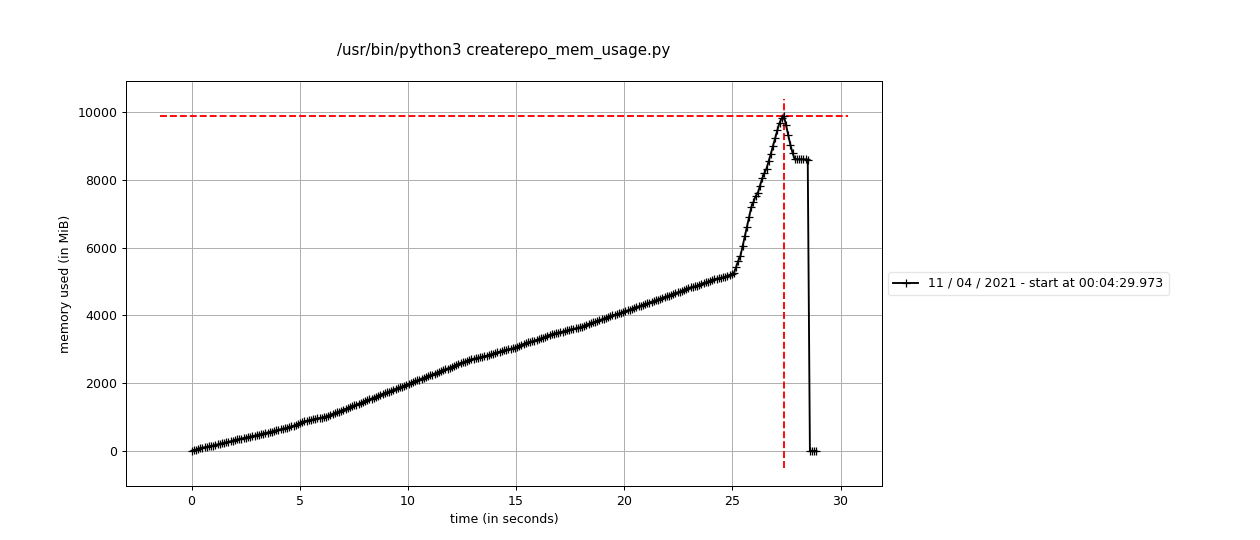
Here's what happens (using the same minimized script) if you parse the repo and then go through all the results and then pull the data out of some of the fields and store it in a list (like we do in the sync pipeline).
So there's 2 ways to approach minimizing these issues, and I think we should try to do both:
Mitigation 1 is to get rid of the createrepo_c package object as soon as we're done with it, like this:
    while True:
        try:
            # instead of iterating over the dict, we pop items from the dict so that the memory can be freed
            # so we go back to only having one copy of the data around - in the form of all of the strings we pull from the package
            (_, pkg) = packages.popitem()
        except KeyError:
            break

        do_whatever(pkg)
        del pkg  # just in case
Here's what that looks like
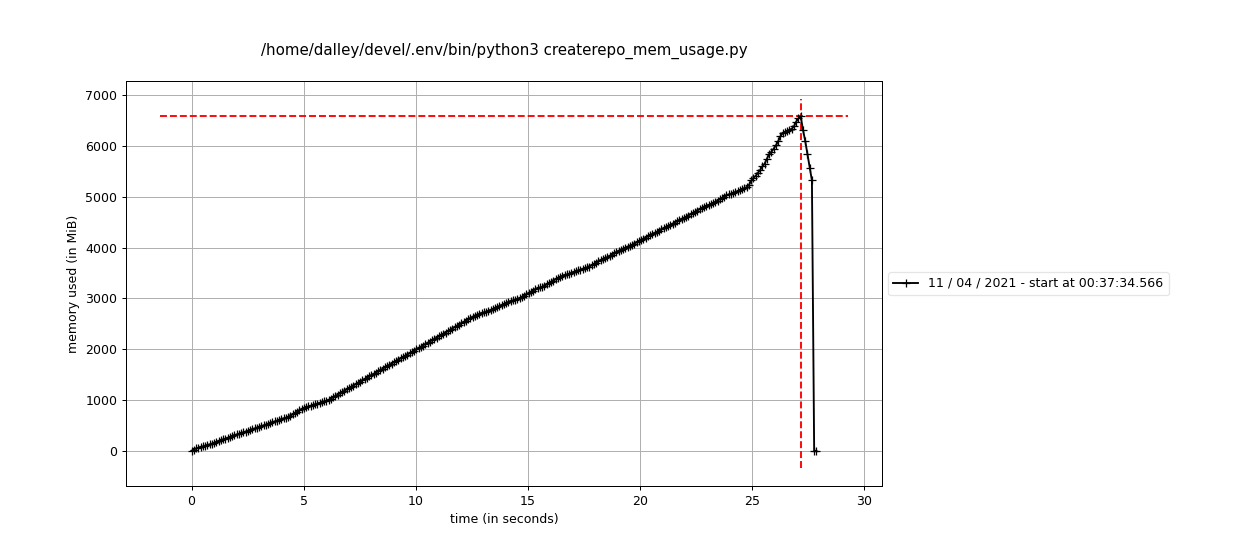
Definitely better. I think we can merge that immediately and re-run the test to see whether that is sufficient for our short-term needs.
Mitigation 2 is that we should take a more comprehensive look at the sync pipeline and make sure we're applying backpressure to the first stage, so that it's not pumping data into the pipeline faster than it can be processed. Because any backups there would result in these kinds of issues (admittedly only for the RPM plugin due to the whole language boundary thing).
Updated by dalley over 3 years ago
There's also potentially a mitigation 3, but it's kind of speculative. I'd want to talk with the createrepo_c developers about it.
Basically since they're dealing with so many strings, and dealing with strings in C is such a pain in the butt, they store them in per-package arena allocator things [0] which has the benefits of really simplifying the memory management, and also making things faster by reducing the number of allocations and deallocations. But benefit #2 comes from over-allocating with big blocks of memory to store multiple strings at once. So it's possible that there bunch of extra memory lying around not actually being used.
But, I'm unsure of the exact details here, and I'm not sure how much we can realistically do about it. Use of these is pretty baked in (and is a pretty good idea, all things considered) but maybe it can be tuned a bit.
My experiments thus far have not made any difference however.
[0] https://developer.gnome.org/glib/stable/glib-String-Chunks.html
Updated by dalley over 3 years ago
Patch: https://github.com/pulp/pulp_rpm/pull/1968
Using a machine with 9.6gb of RAM and syncing the OL7 repo, I can finish the sync successfully with a peak system memory consumption of around 8.5gb.
Without the patch I OOM
That is likely still not good enough, but it is a solid improvement.
Updated by dalley over 3 years ago
- Status changed from NEW to ASSIGNED
- Assignee set to dalley
 Updated by pulpbot over 3 years ago
- Status changed from ASSIGNED to POST
Updated by dalley over 3 years ago
- File Screenshot from 2021-04-12 18-23-16.png Screenshot from 2021-04-12 18-23-16.png added
- File Screenshot from 2021-04-12 18-35-22.png Screenshot from 2021-04-12 18-35-22.png added
- File Screenshot from 2021-04-12 18-36-21.png Screenshot from 2021-04-12 18-36-21.png added
Documenting this for possible future reference:
The charts I made earlier were made using the Python "memory-profiler" tool with the following commands:
mprof run createrepo_mem_usage.py
mprof plot
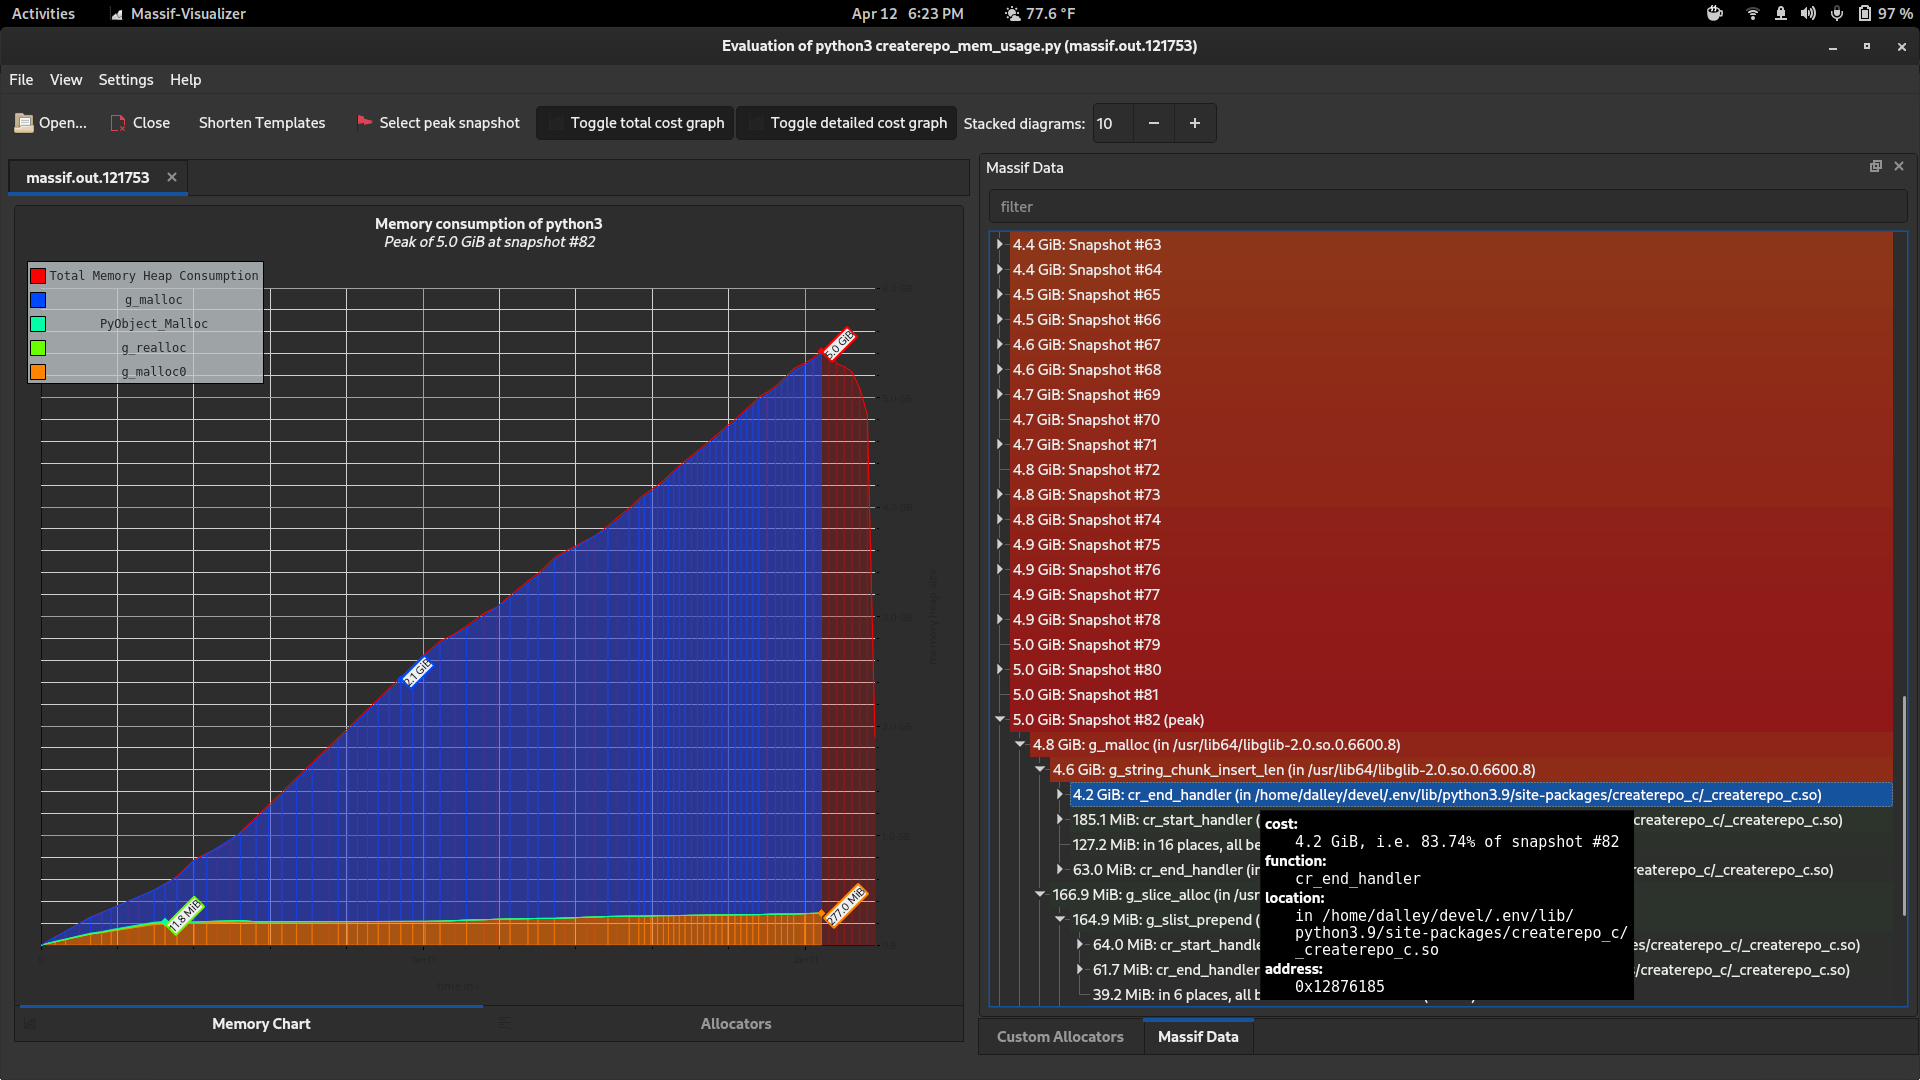
There are some other tools I found which are also really useful. valgrind's "massif" tool works with Python / C extension code too, and it gives much more detailed information, at the expense of slowing down the program significantly (4-5x)
valgrind --tool=massif python3 createrepo_mem_usage.py
massif-visualizer massif.out.124970
Those charts look like this: (before / after)
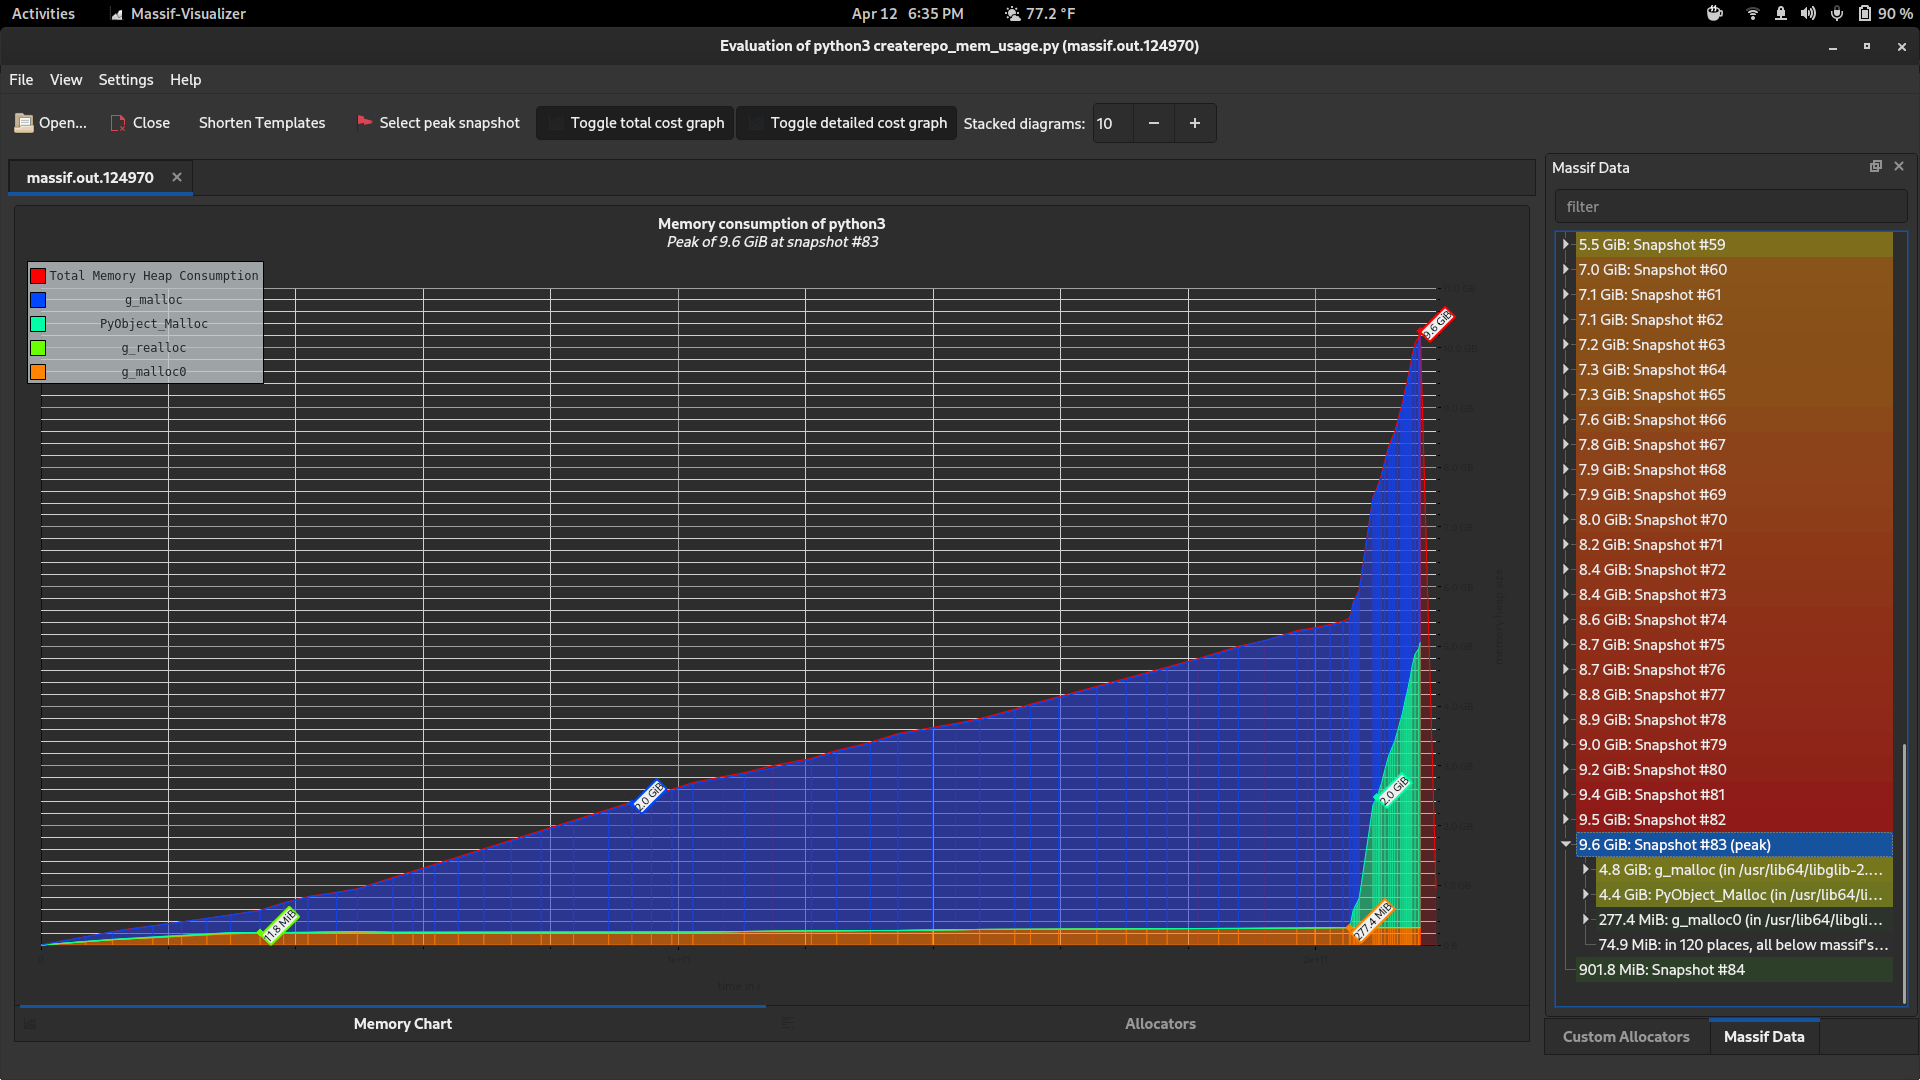
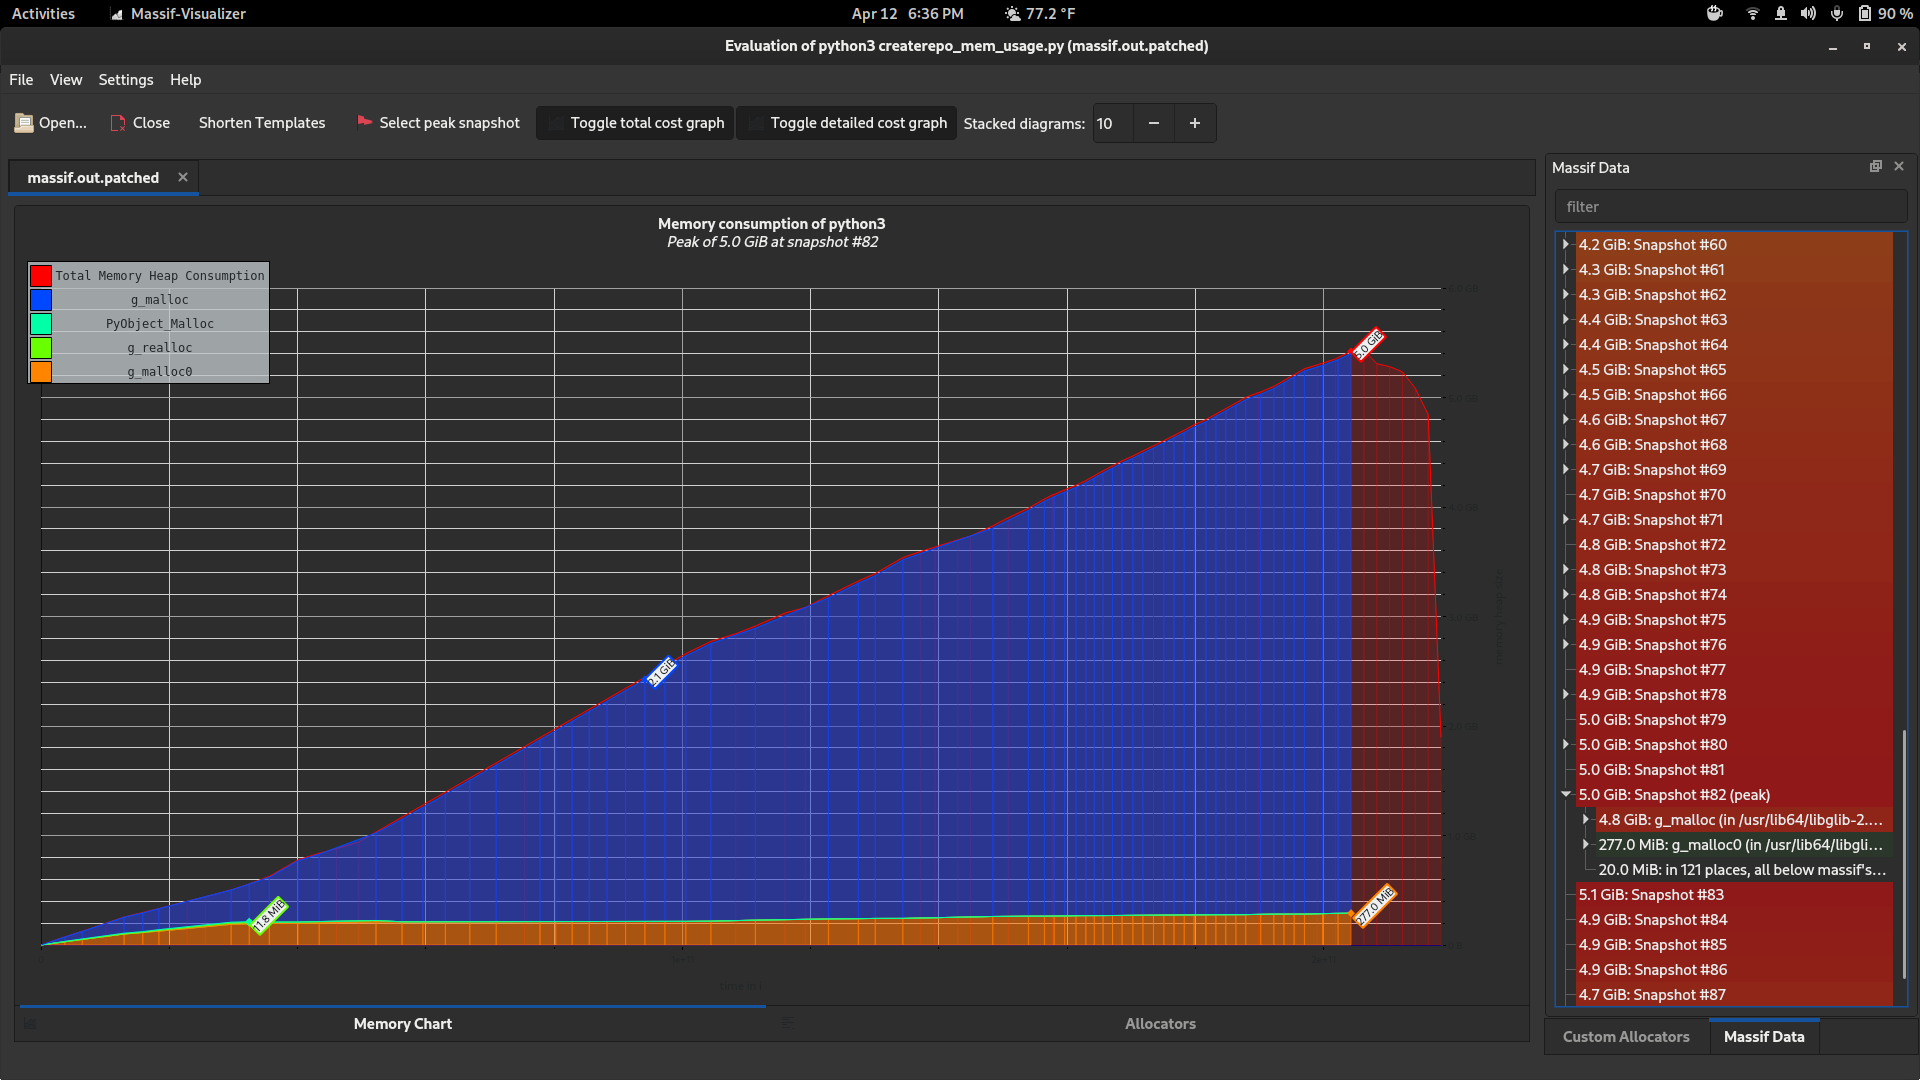
Notice how it can show you snapshots at a bunch of different points in time and also tells you where the allocations came from (which allocators, and which functions, allocated how much).
I wish I'd known about that earlier, it's awesome.
I was also pointed towards the heaptrack tool, I never got to the point of playing around with it, but it looks similarly cool and potentially even more powerful
https://github.com/KDE/heaptrack
So if we run into any memory issues in the future, there's some really good tools available for debugging them.
Added by dalley over 3 years ago
Updated by dalley over 3 years ago
- Status changed from POST to MODIFIED
Applied in changeset 7b1b1729d17ff0d56e75bf3eca89317291a77ae1.
 Updated by ttereshc over 3 years ago
- Related to Backport #8753: Backport #8467 to 3.11 added
Updated by pulpbot over 3 years ago
- Status changed from MODIFIED to CLOSED - CURRENTRELEASE
Reduce memory consumption when syncing extremely large repositories
closes: #8467 https://pulp.plan.io/issues/8467